02: LUNA… IN RADIO
THE MOON IN RADIO⌗
Taking optical images of the night’s sky is one task; capturing celestial objects in other wavelengths is another beast. You may not realize imaging sky in radio is even possible – but not only is it possible, it’s very useful! “Seeing” the sky in radio allows astronomers to discover objects not visible to the human eye or optical telescopes. Some distant objects, for example, are impossible or difficult to see in the visible light spectrum because of visual obstructions like dust and gas clouds. Radio waves, however, can penetrate these obstacles because they have a longer wavelength than visual light! Radio observing is also very practical because it can be done in daylight and through clouds, unlike optical observing. Other benefits we will explore later include radio astronomy’s ability to detect polarization and emittance variance of objects in real time.
Because the radio telescopes we use have such a small field of view, we have to use an observing technique where the telescope effectively scans the sky in a zig-zag pattern, and the sky in-between the lines of the zig-zag (not directly observed) are infered using an advanced algorithm. We used the 20-meter radio telescope at Green Bank Observatory in West Virginia. We pick our frequency range (1355-1435 MHz), being careful to pick a range that omits human-made frequencies, and specify a sum of the channel inputs. When the data comes back, we can view it on the National Radio Astronomy Observatory’s website! Check out the data retrieved from a radio observation of Virgo A.

From left to right: the observation’s scan/mapping pattern, imaged Y channel, and imaged X channel.
–
When we process these raw images, we are able to account for the time delay obvious in the X and Y channel images, and we put together an image that looks like this!

–
Past the methods of radio imaging, we wanted to determine whether the Moon’s radio emission fluctuates similarly to its variance in visual brightness throughout its phasic cycle. To test this, as a group, we took four observations: two Lunar observations four days apart and two calibration source observations on the same days. The calibration sources allow us to more accurately determine the flux of emission between the two Lunar observations.
Here is the table we used to calculate the energy flux and temperature of the Moon using Virgo A as our calibration source. We ultimately determined the radio fluctuation was too small to be due completely to the phases of the Moon (the reflected light from the Sun).

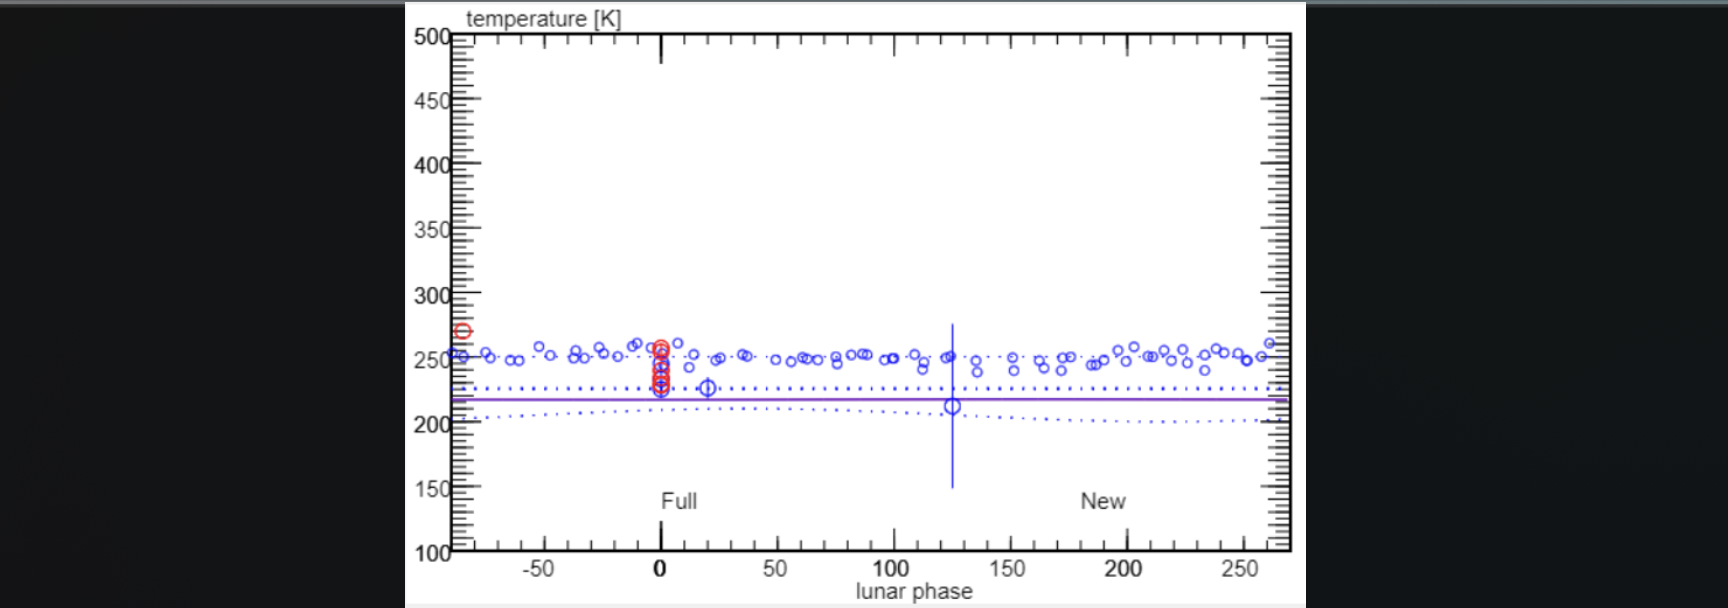
We can also measure the temperature of the Moon from our observations and compare our values to the pros! Our measurement of ~230 Kelvin aligns with not only the pros’ measurements, but is closer to the actual value of temperature!

I can’t wait to continue to view the Universe through a radio lense!